OT Snapshot Reporter
Read-only, offline-friendly Windows operational state reporter for synthetic OT-style environments - collectors, baselines, prior snapshots, severity, and static HTML/CSV evidence.
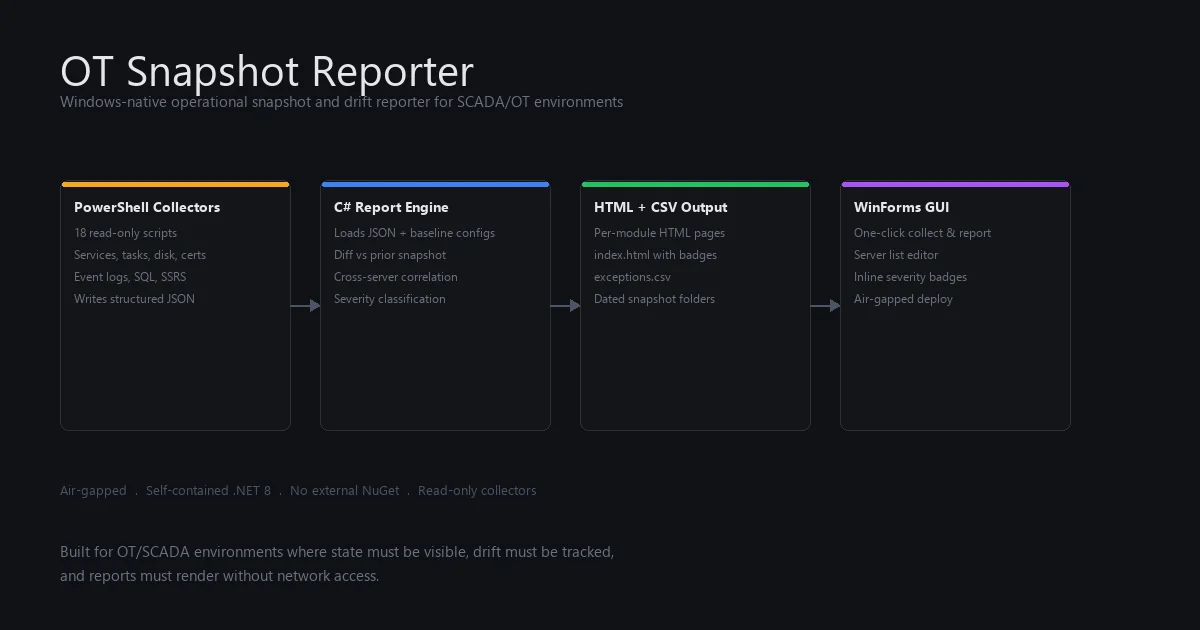
I built a read-only, offline-friendly Windows operational state reporter that turns manual operational checks into repeatable evidence: current snapshot, expected baseline, previous snapshot, severity, and static reports.
The tool works from a configured list of known hosts. PowerShell collectors gather generic Windows operational state, write structured JSON snapshots, and a dependency-light C# report engine compares each run against expected baselines and previous snapshots before producing static HTML/CSV evidence.
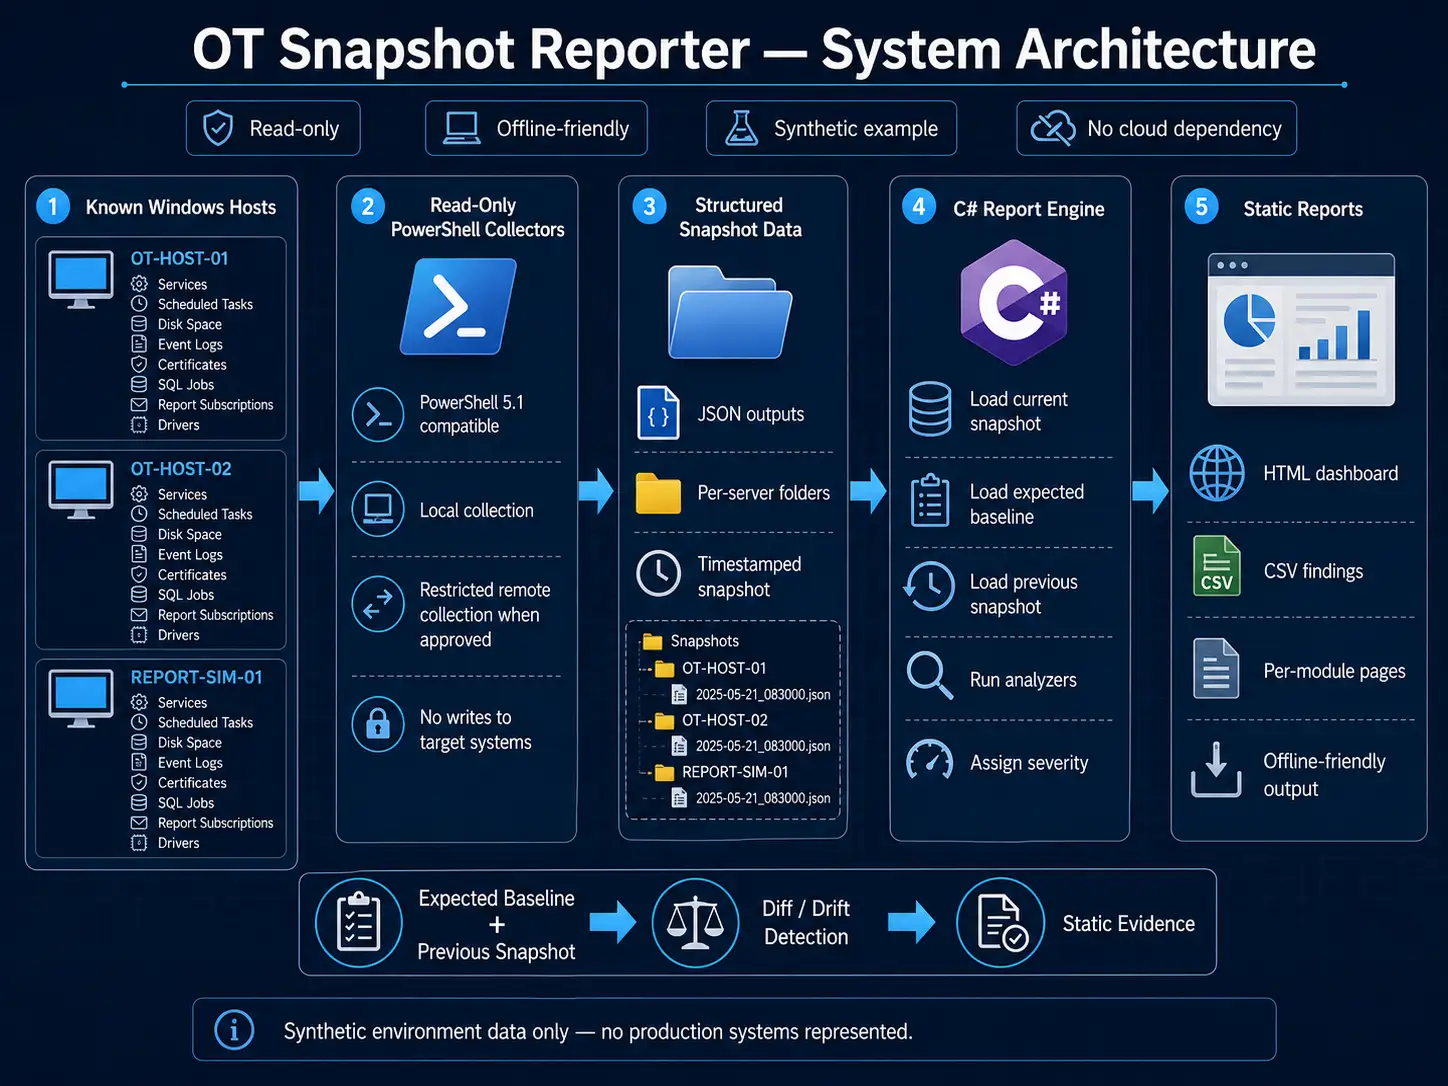
Architecture
Three layers work together:
- Read-only collectors - each module targets one aspect of Windows operational state and writes structured JSON output
- C# report engine - loads collector JSON, expected baseline configs, and a previous snapshot; runs analyzers per module; computes diffs; assigns severity; generates module pages and a top-level static report
- Windows launcher - edits known-host lists, runs collectors and the engine, summarizes severity counts, and opens generated reports locally
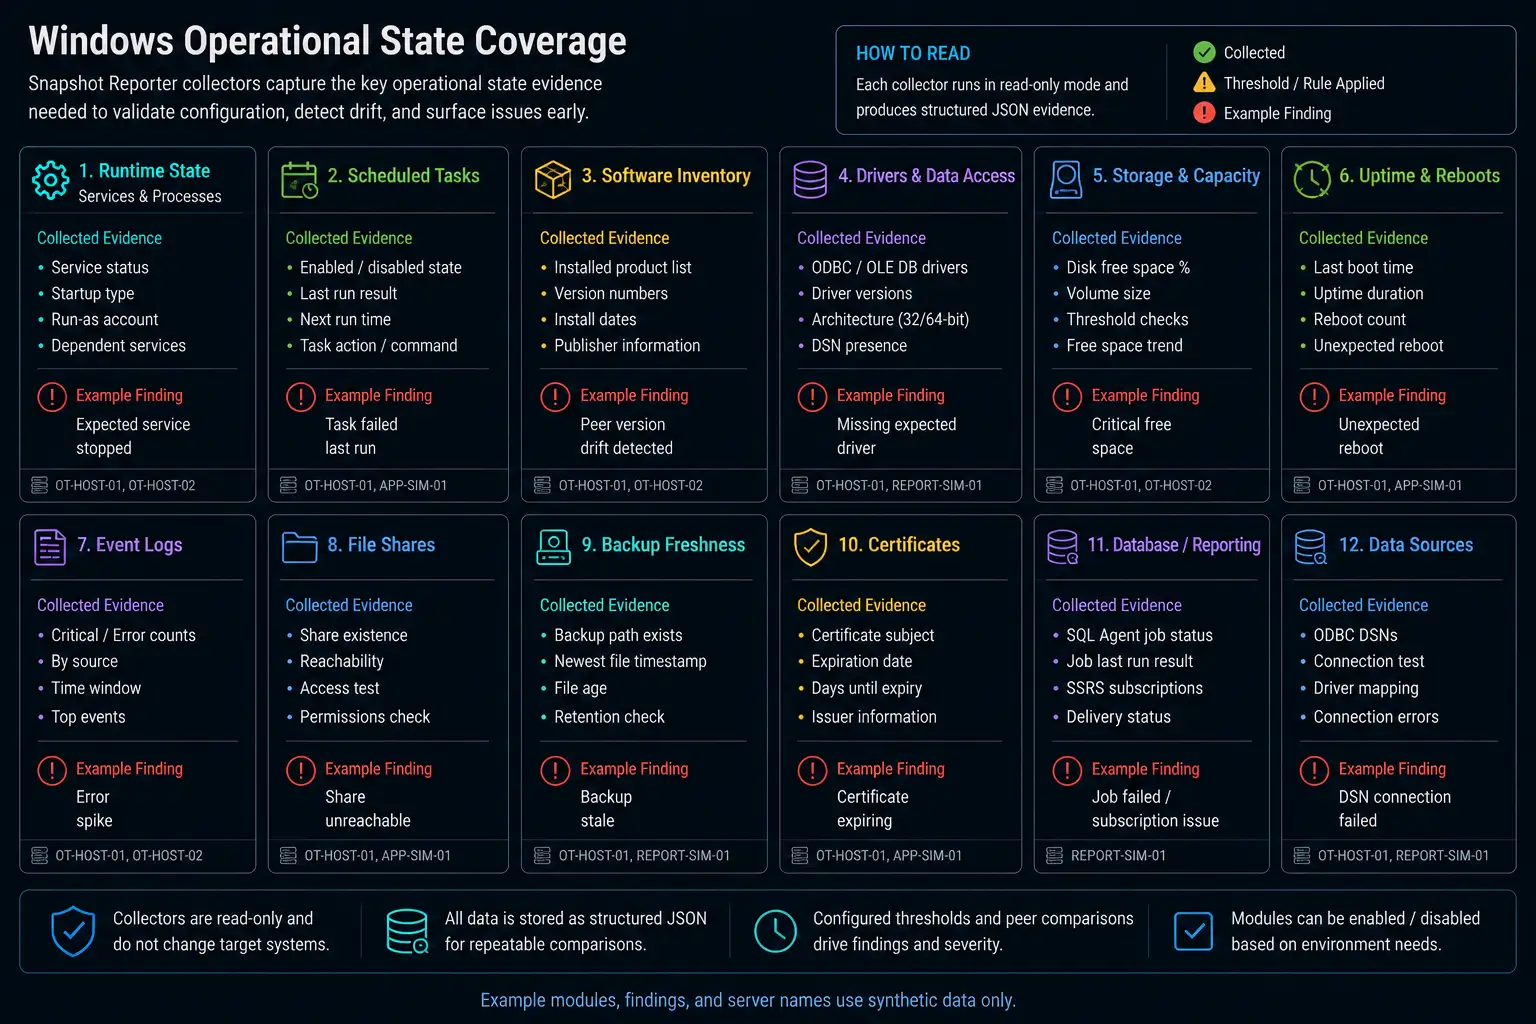
Modules and coverage
- Runtime state - running/stopped/startup-type drift against expected baselines
- Scheduled tasks - enabled state, last run result, account label, and action changes
- Software inventory - cross-host version matrix with peer comparison
- Drivers and data access - driver presence, version, architecture, and install location
- Storage and capacity - free percentage with warning/critical thresholds and drop detection
- Uptime and reboots - last boot time and unexpected reboot evidence
- Event summaries - critical/error event counts by source and time window
- File shares - configured reachability checks using synthetic example paths
- Backup freshness - newest file age vs threshold and missing expected outputs
- Certificates - expiry tracking, days-until-expiry, and store location
- Database/reporting checks - status, duration, owner label, enabled state, and delivery summary
- Data sources - per-source connectivity status, driver label, and configuration summary
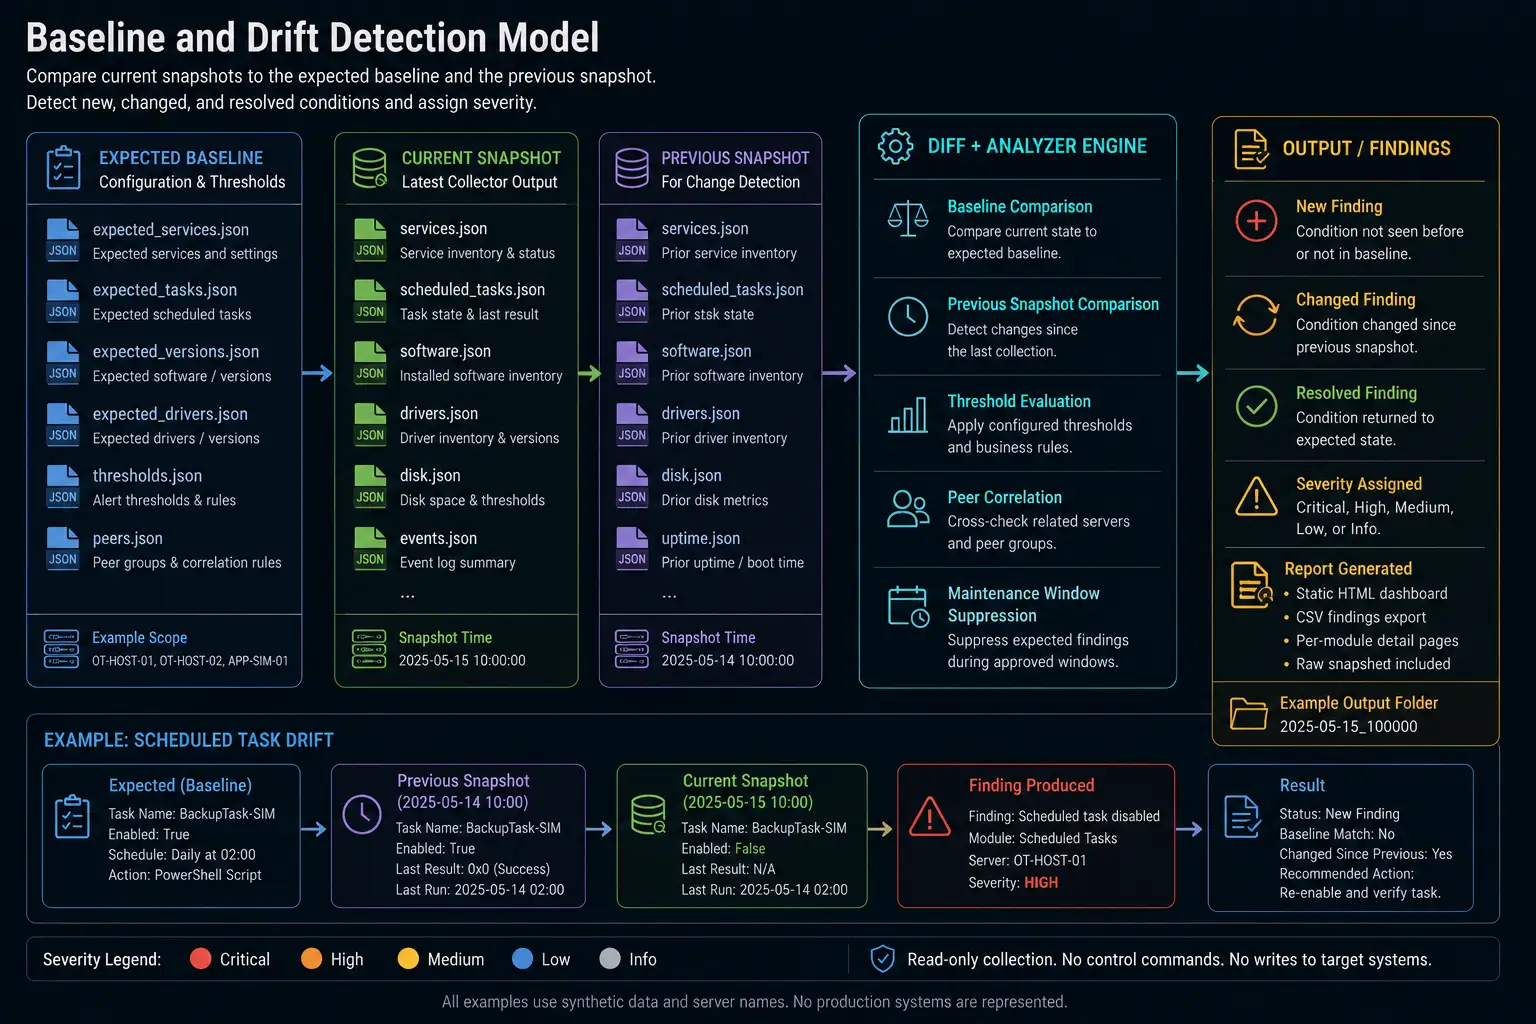
Baseline and drift detection
The engine compares each current snapshot against both expected configuration and the prior run so the report can separate baseline violations from newly introduced drift.
Severity model
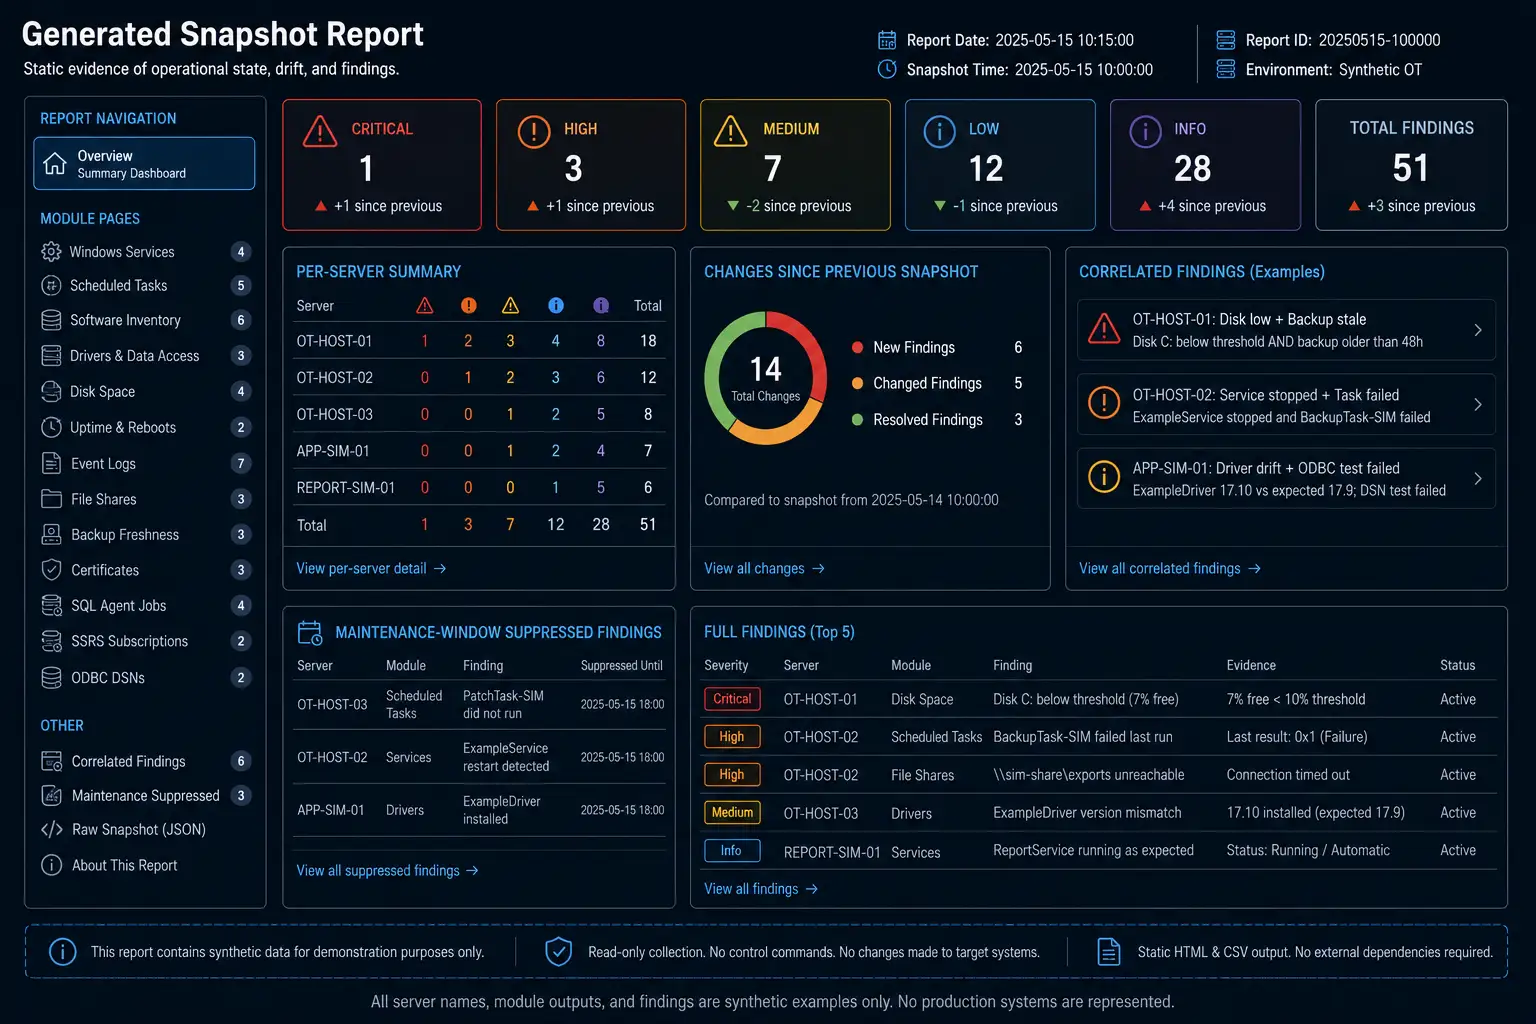
- Critical - expired certificate, critically low disk, or expected critical runtime state missing
- High - unexpected reboot, failed scheduled task, key version drift, or unreachable expected share
- Medium - task not run recently, driver version mismatch, or moderate capacity drop
- Low - new software on a non-peer host or minor inventory change
- Info - expected state confirmed, connectivity status, or maintenance-window-suppressed finding
Correlation and maintenance windows
When the same finding appears on multiple known hosts, the engine surfaces it as a correlated finding so the report can distinguish isolated drift from shared operational conditions. Maintenance windows suppress planned-work findings to Info with the window label attached.
Generated reports
The static report turns collector output into a reviewable evidence package with severity counts, per-host summaries, correlated findings, suppressed planned-work items, and module-level detail.
Deployment
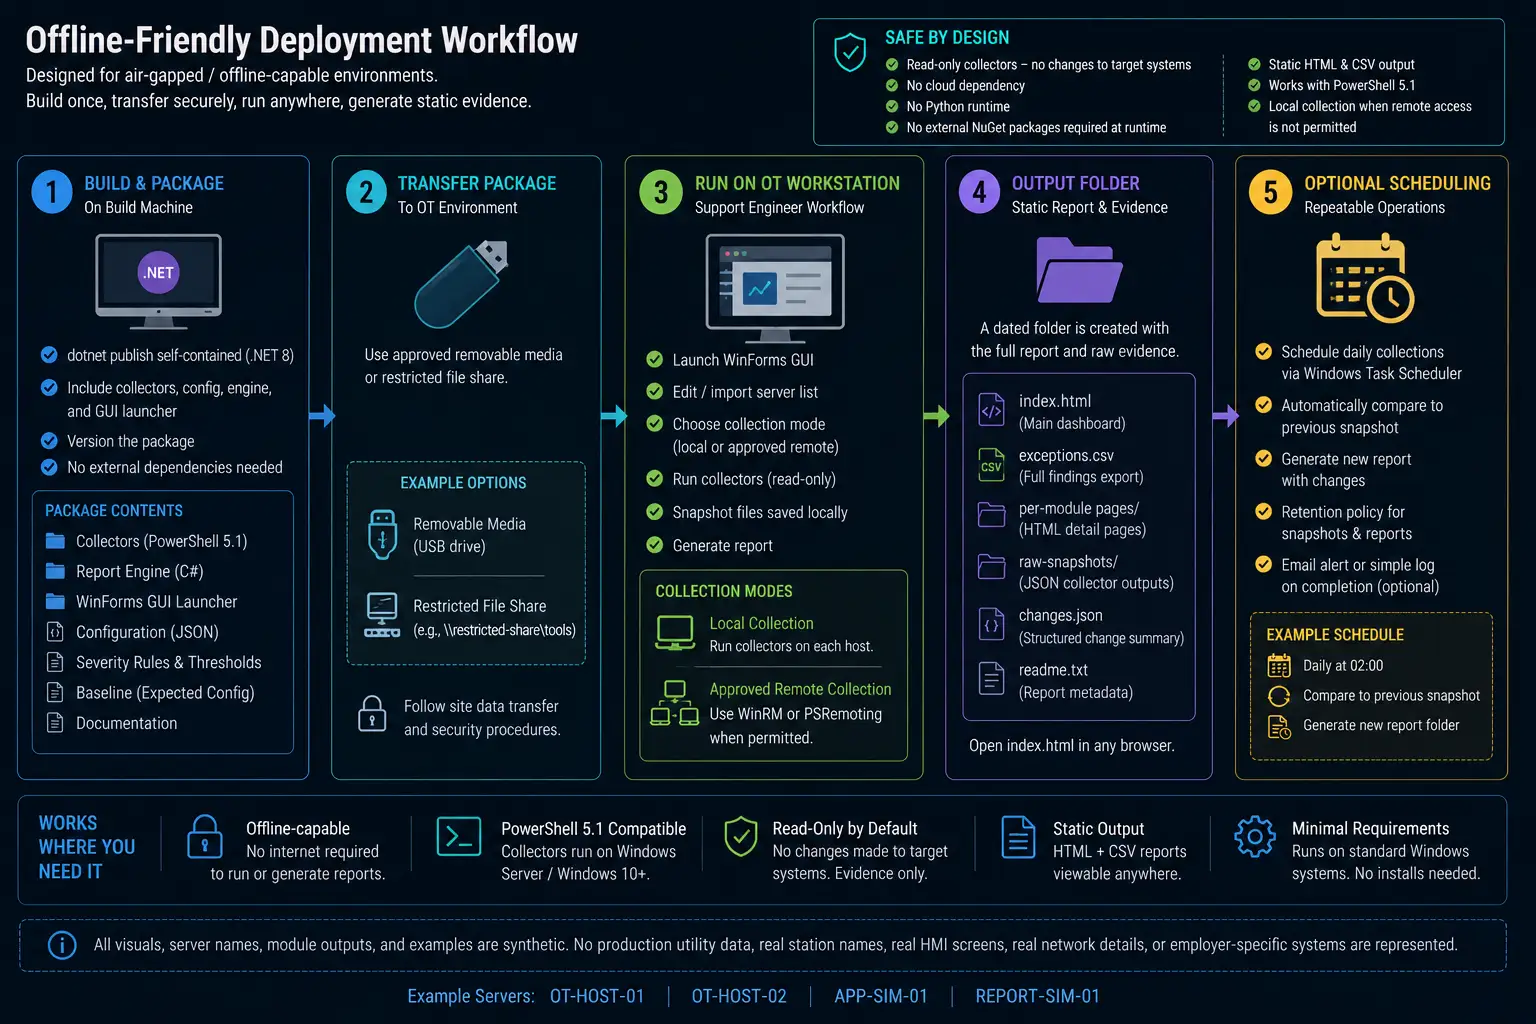
The deployment model is offline-friendly and intentionally simple:
- Self-contained Windows package built once and transferred through an approved workflow
- PowerShell collectors using built-in Windows capabilities
- Local collection mode for workstations where remote execution is unavailable
- Optional Windows Scheduled Task wrapper for repeatable collection
- No cloud requirement, no Python dependency, and no runtime package download
Test suite
- C# tests covering analyzers, diff engine, CSV output, loading, and report modules
- PowerShell smoke tests validating collector output schema and engine integration
- Config validation script for pre-run sanity checks
- Hardening tests focused on read-only behavior and predictable local output
Safety note
This is a public generic reference implementation. It is not affiliated with any employer, utility, vendor, or production environment. All visuals use synthetic hostnames, synthetic module outputs, and simulator-style examples. No production utility data, real station names, real HMI screens, real network details, real credentials, or employer-specific systems are represented. Real collector output and generated reports must not be committed to public repositories.
Next steps
Explore the adjacent operational tooling.
This reporter fills an operational evidence gap in the stack - see how it connects to telemetry quality and plant-state modeling.