Signal Quality Engine
Real-time DSP pipeline for SCADA telemetry - filtering, drift detection, spike detection, oscillation analysis, and composite signal quality scoring.
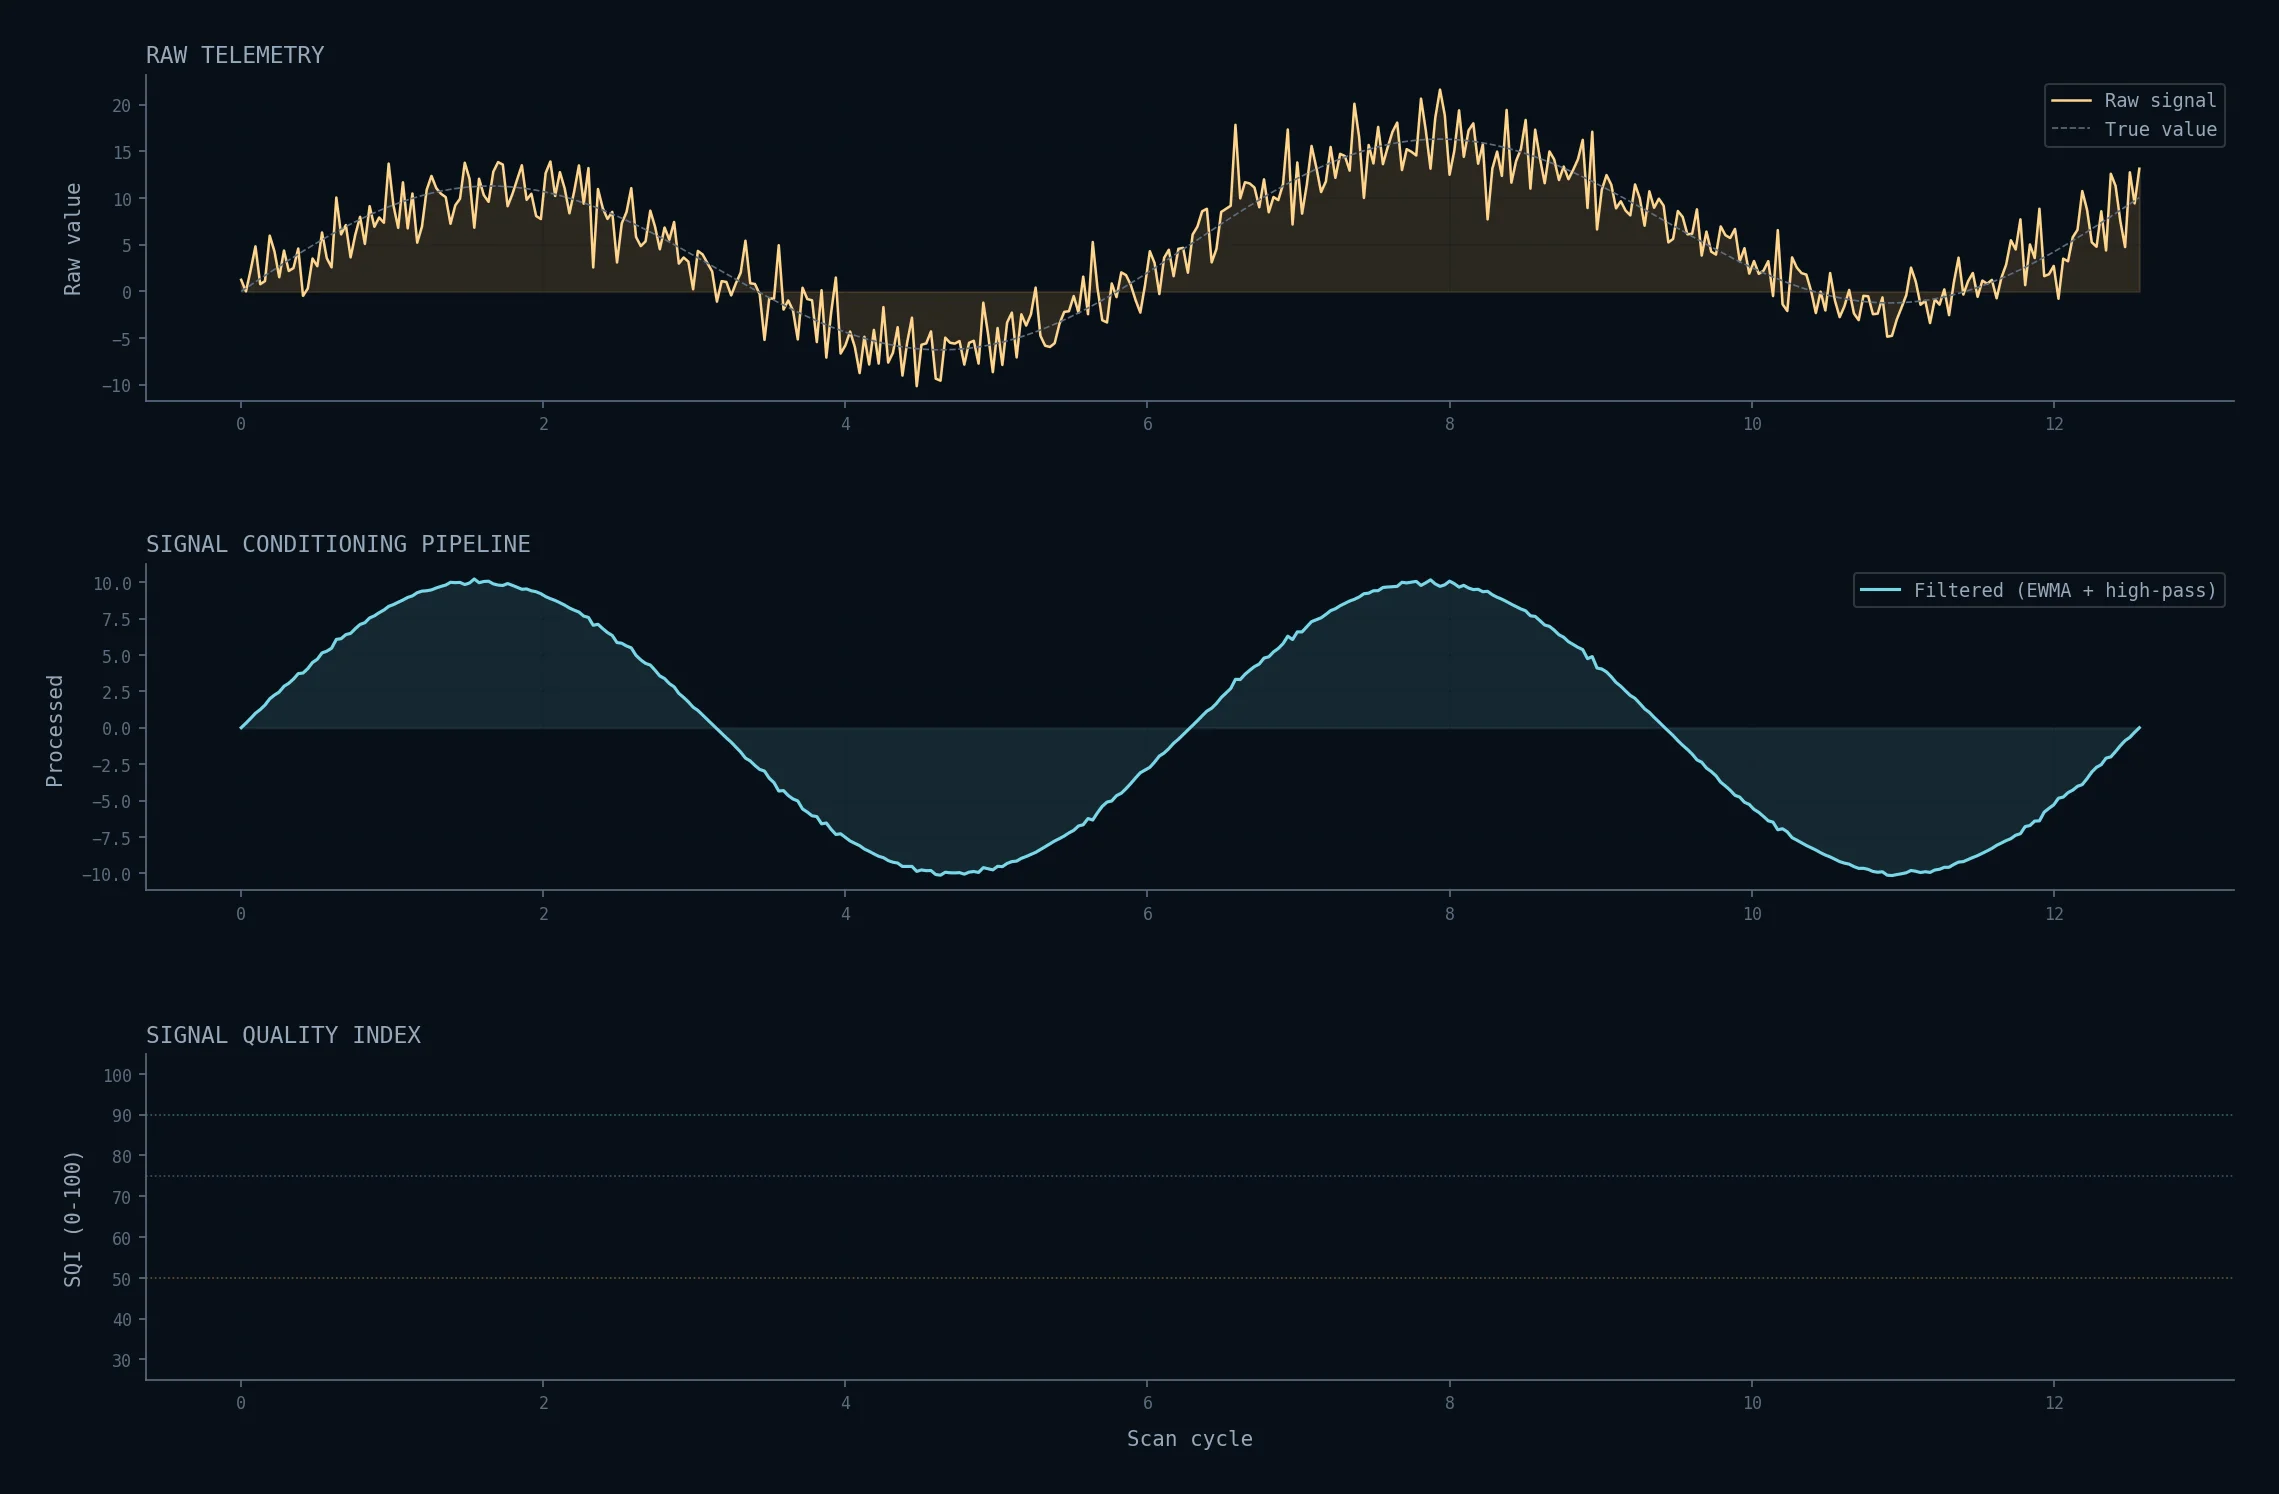
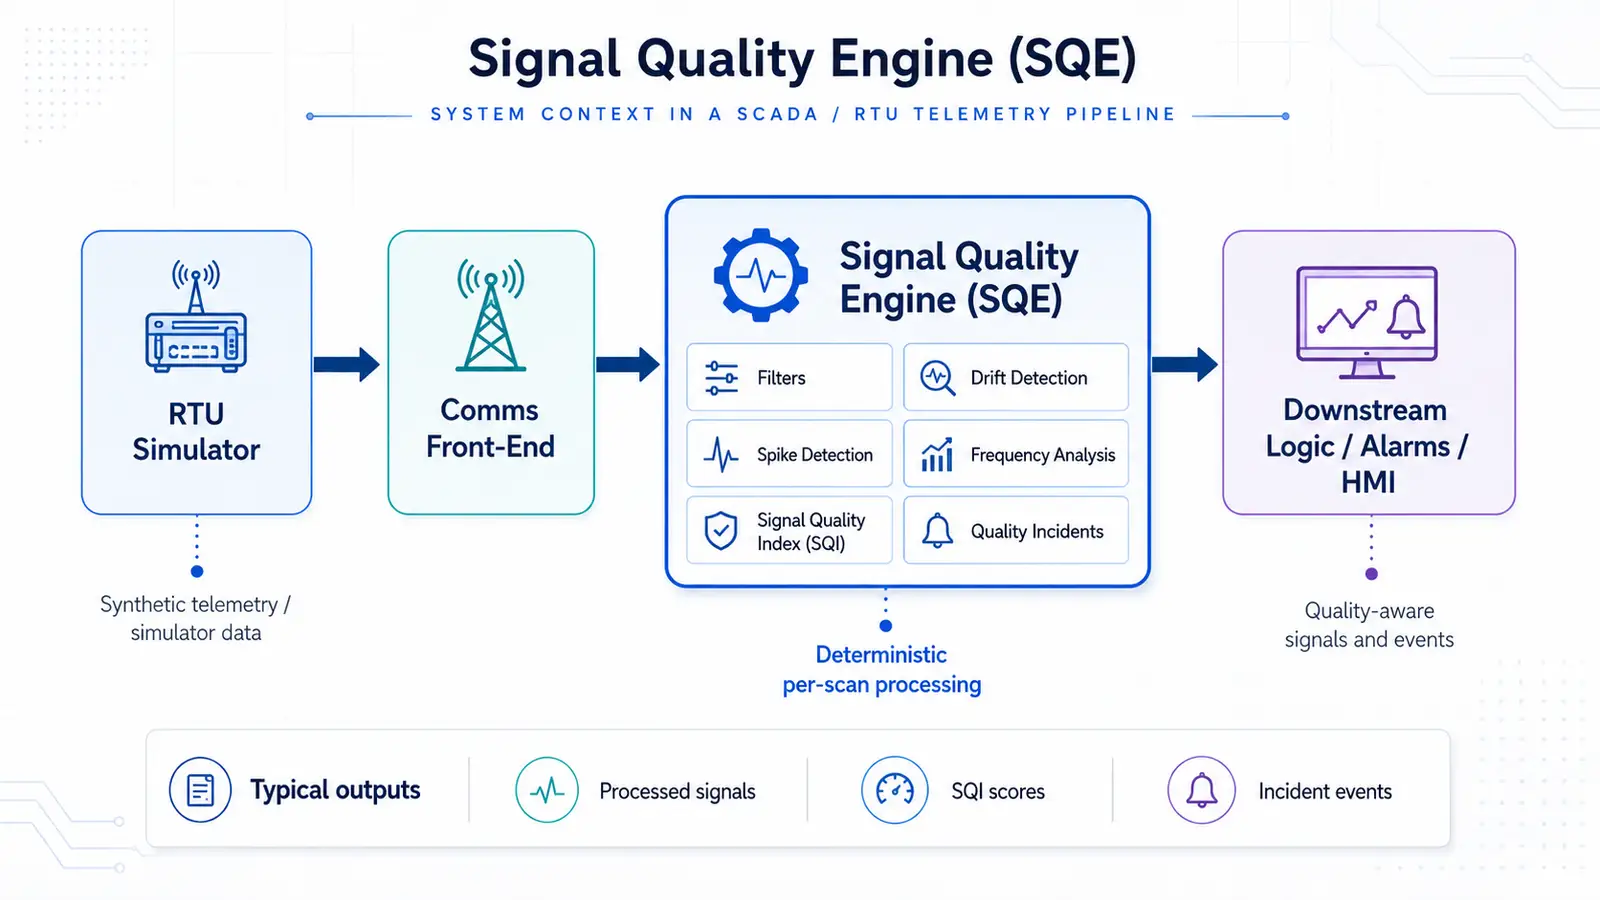
Real-time digital signal processing engine that sits between RTU telemetry sources and downstream control logic, providing filtering, anomaly detection, and a composite Signal Quality Index (SQI) scored 0-100.
The engine is deterministic by design - no background threads, no async, predictable timing at ~0.1-0.2ms per signal per scan. It ships with a CLI, a replay harness, integration adapters for the companion simulators in this stack, and a full evaluation pipeline.
The diagrams below use synthetic telemetry to show where the engine sits, how each scan is processed, and how quality results become replayable evidence.
Pipeline
Each scan processes every registered signal through a fixed sequence of DSP stages:
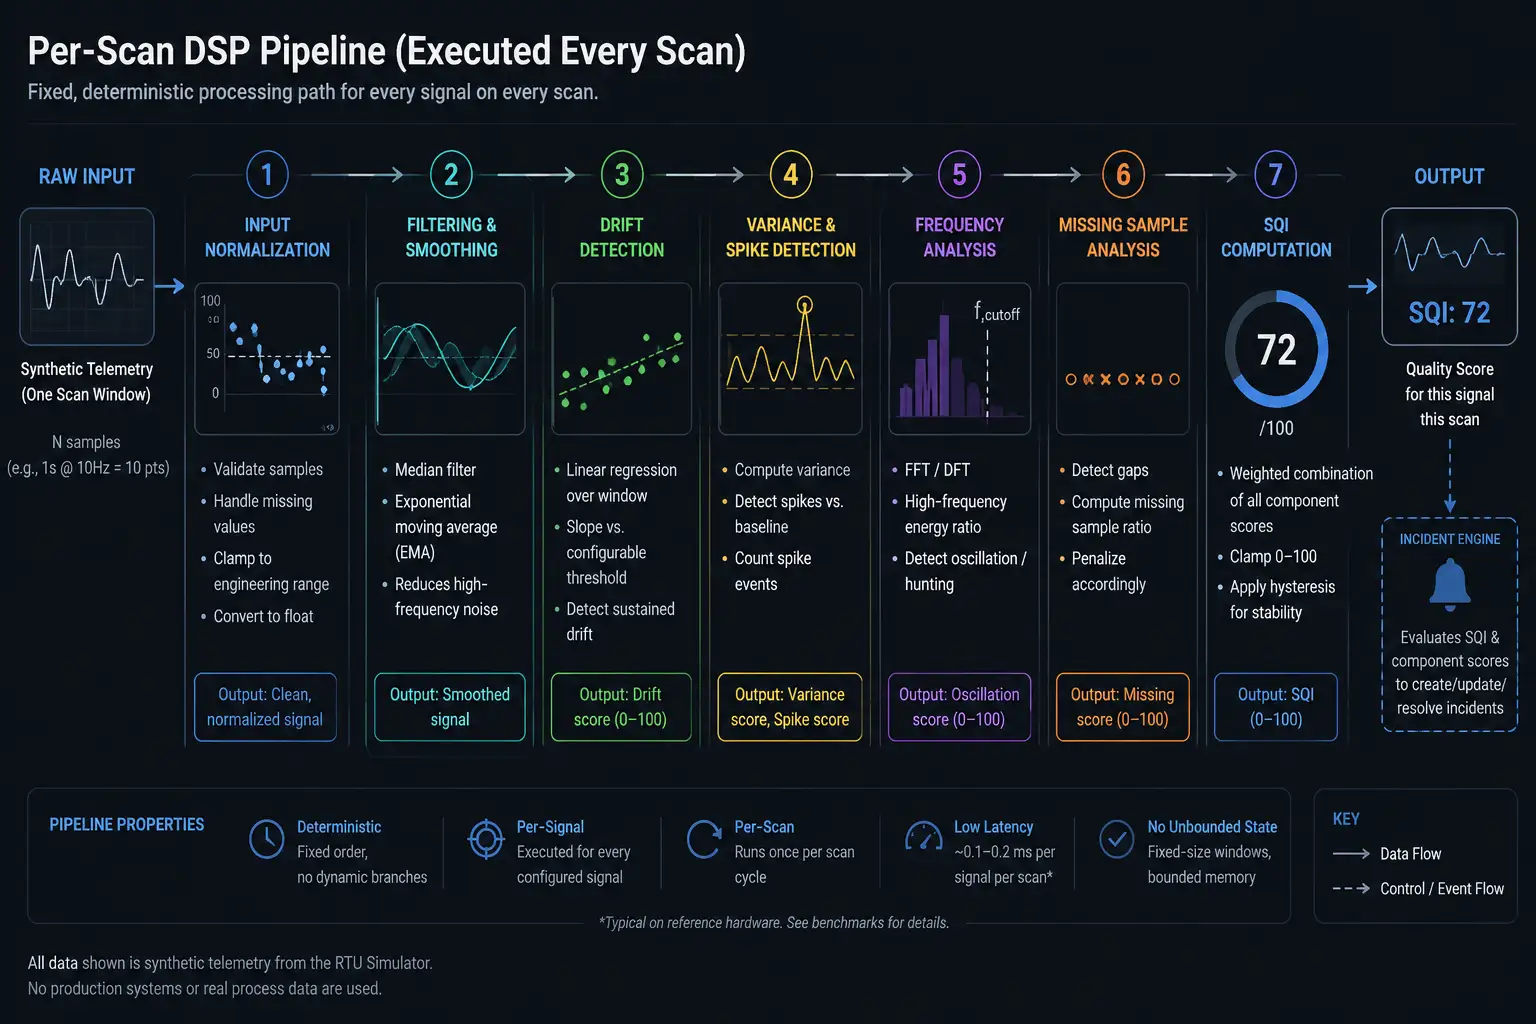
- Filter bank - EWMA, high-pass, and simple moving average run in parallel
- Innovation model - Kalman-inspired residual tracking for drift detection
- Drift classification - sustained, transient, and monotonic drift with configurable thresholds
- Spike detection - sliding-window variance with configurable sigma thresholds
- Frequency analysis - correlation-based and FFT oscillation detection
- Staleness, step-change, and plausibility checks
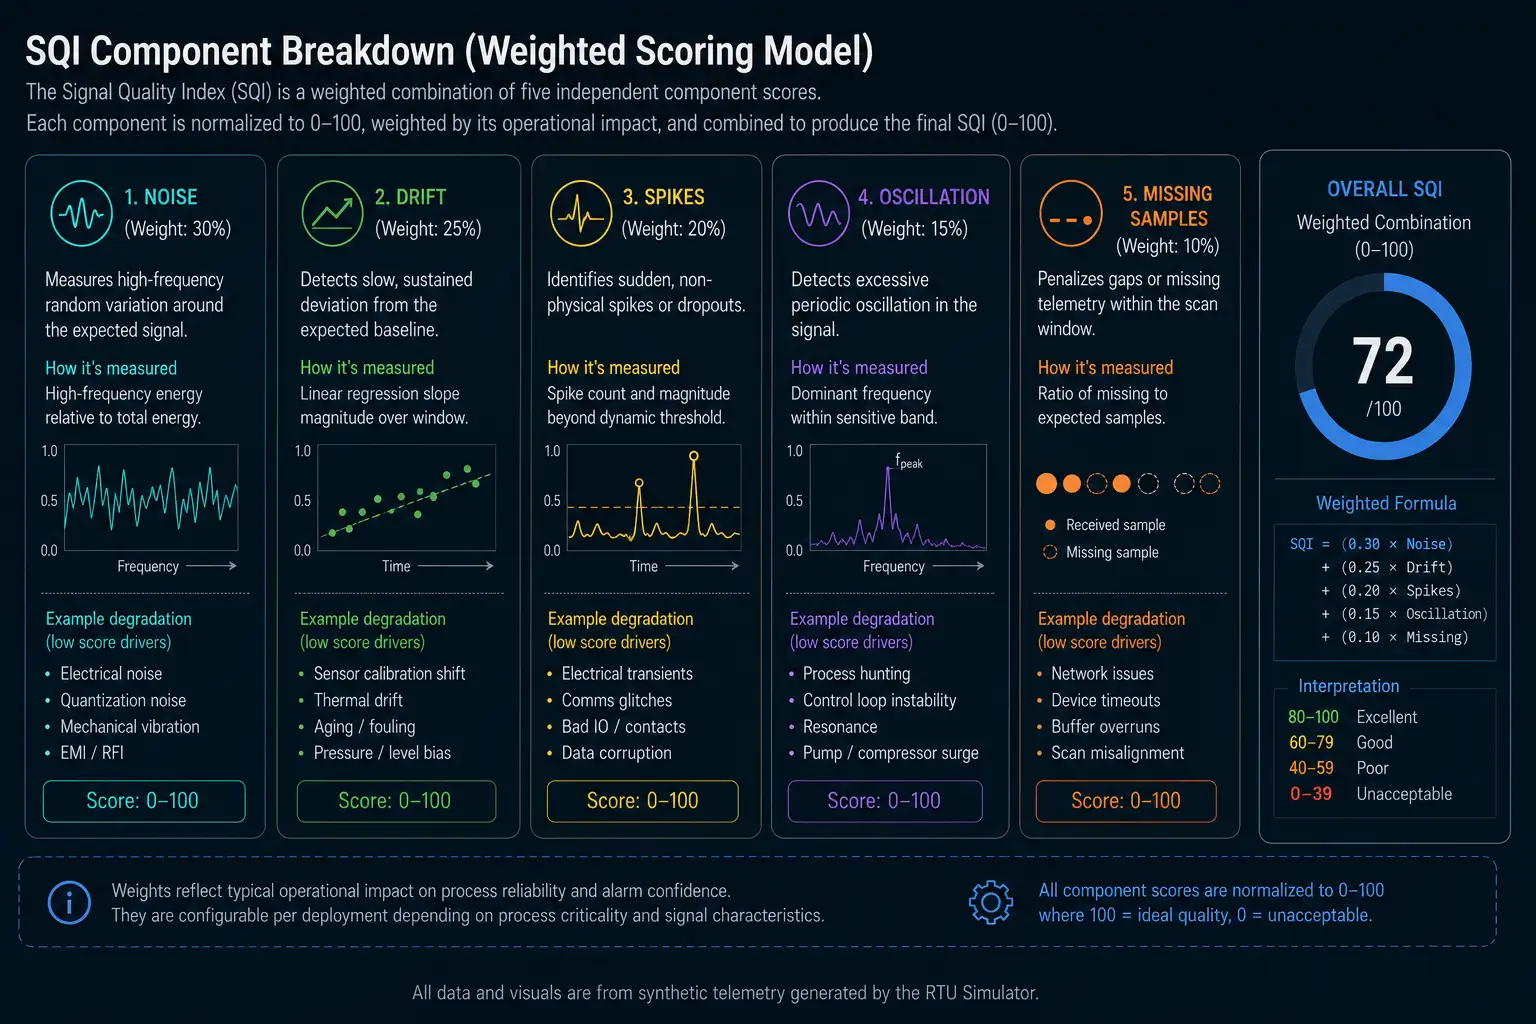
- SQI computation - weighted composite across noise, drift, spikes, oscillation, and missing samples
Signal Quality Index
SQI compresses multiple signal-health indicators into a single 0-100 score while preserving component-level evidence for troubleshooting.
Quality Incidents
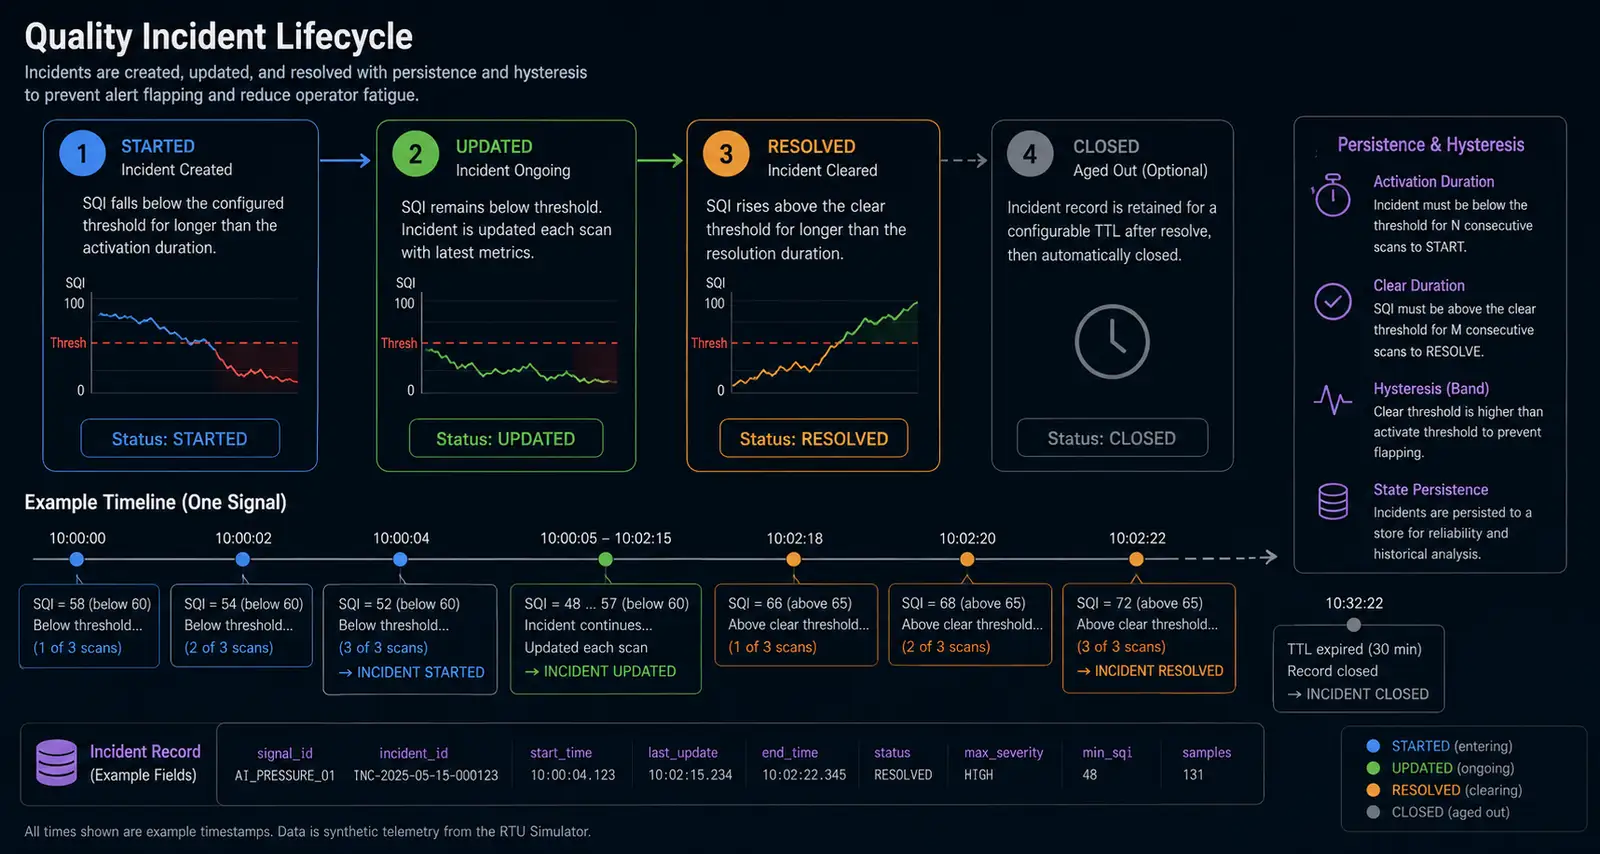
The incident engine consumes SQI scores and emits lifecycle events - started, updated, resolved - with configurable persistence and hysteresis to avoid flapping. Group incidents aggregate related signals (for example, all points on one RTU) into a single event stream. Every incident ID is deterministic and reproducible across replay runs.
Integration layer
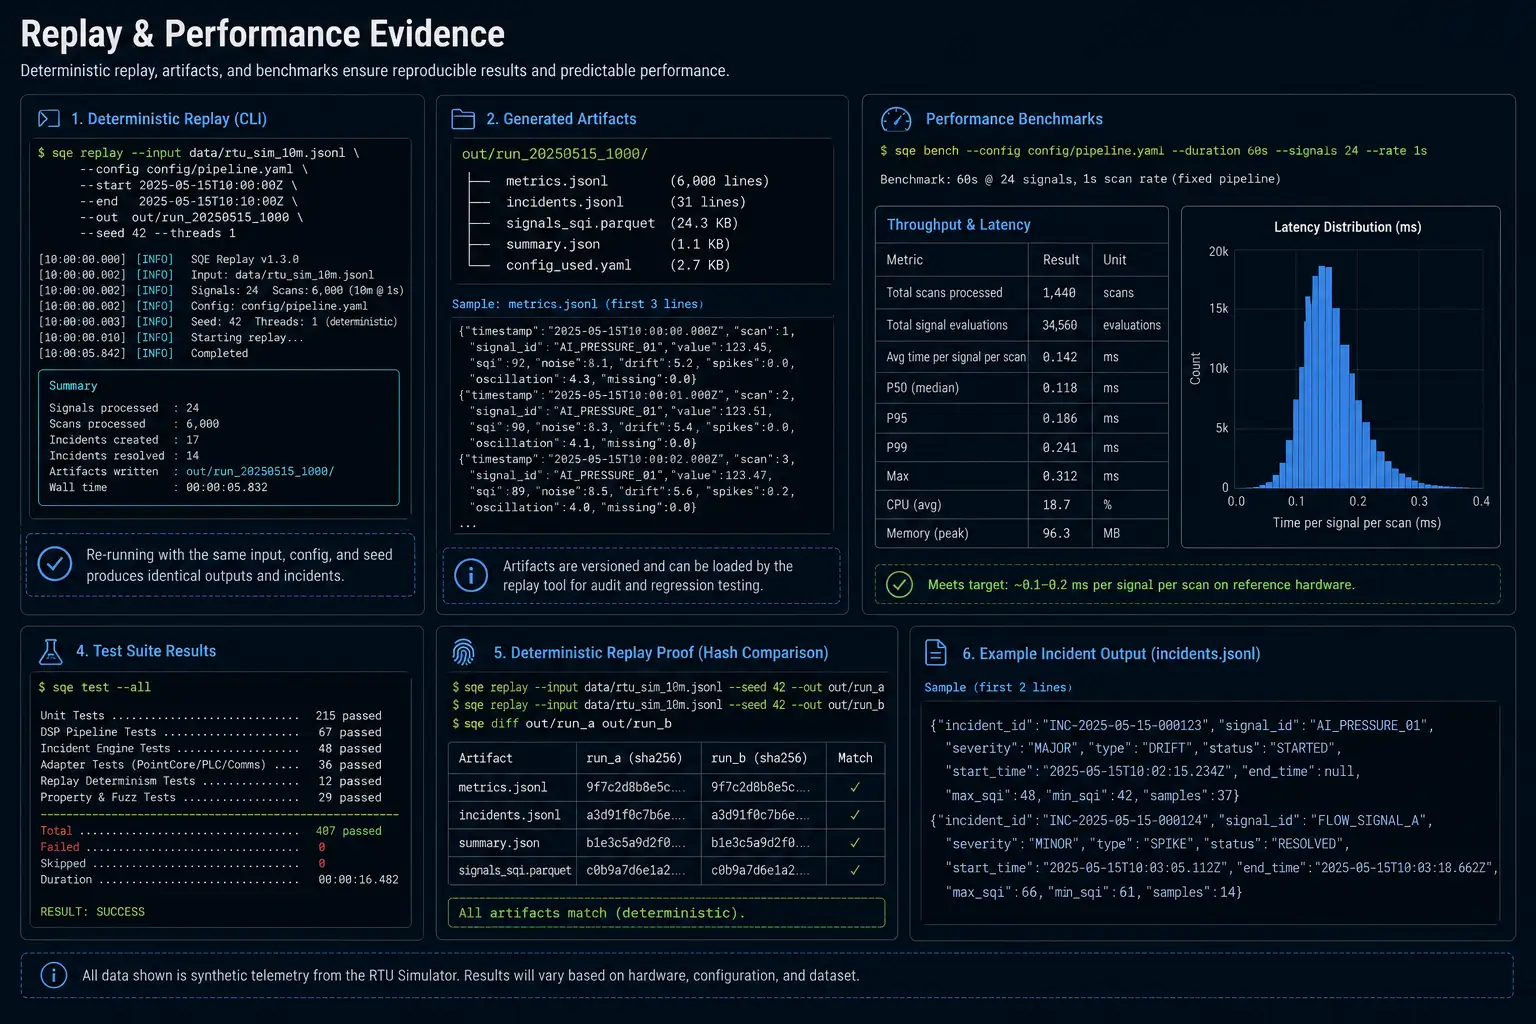
Three adapter modules connect SQE to the companion simulators in this stack:
- PointCore Adapter - ingests raw point signals from the Point Lifecycle Simulator and returns processed results with quality scores
- Scan Adapter - wraps the engine inside a PLC-style fixed-interval scan loop for deterministic simulation
- Comms Adapter - processes signals arriving through the SCADA Comms Front-End, including comms health aggregation
CLI and tools
# Analyze a signal from CSV with plots
sqe analyze --signal-file data.csv --plot

# Simulate synthetic signal processing
sqe simulate --duration 1000 --noise 1.5 --plot

# Generate incident events from a signal file
sqe incidents --signal-file data.csv --out incidents.jsonl

# Deterministic replay with config
sqe replay --in scans.jsonl --config cfg.yaml --out ./output

# Offline parameter tuning
python -m sqe.cli.sqe_cli offline-tuning \
  --replay-input replay.jsonl \
  --labels labels.yaml \
  --sweep-config tuning.yaml \
  --out-dir ./tuning-results
Performance
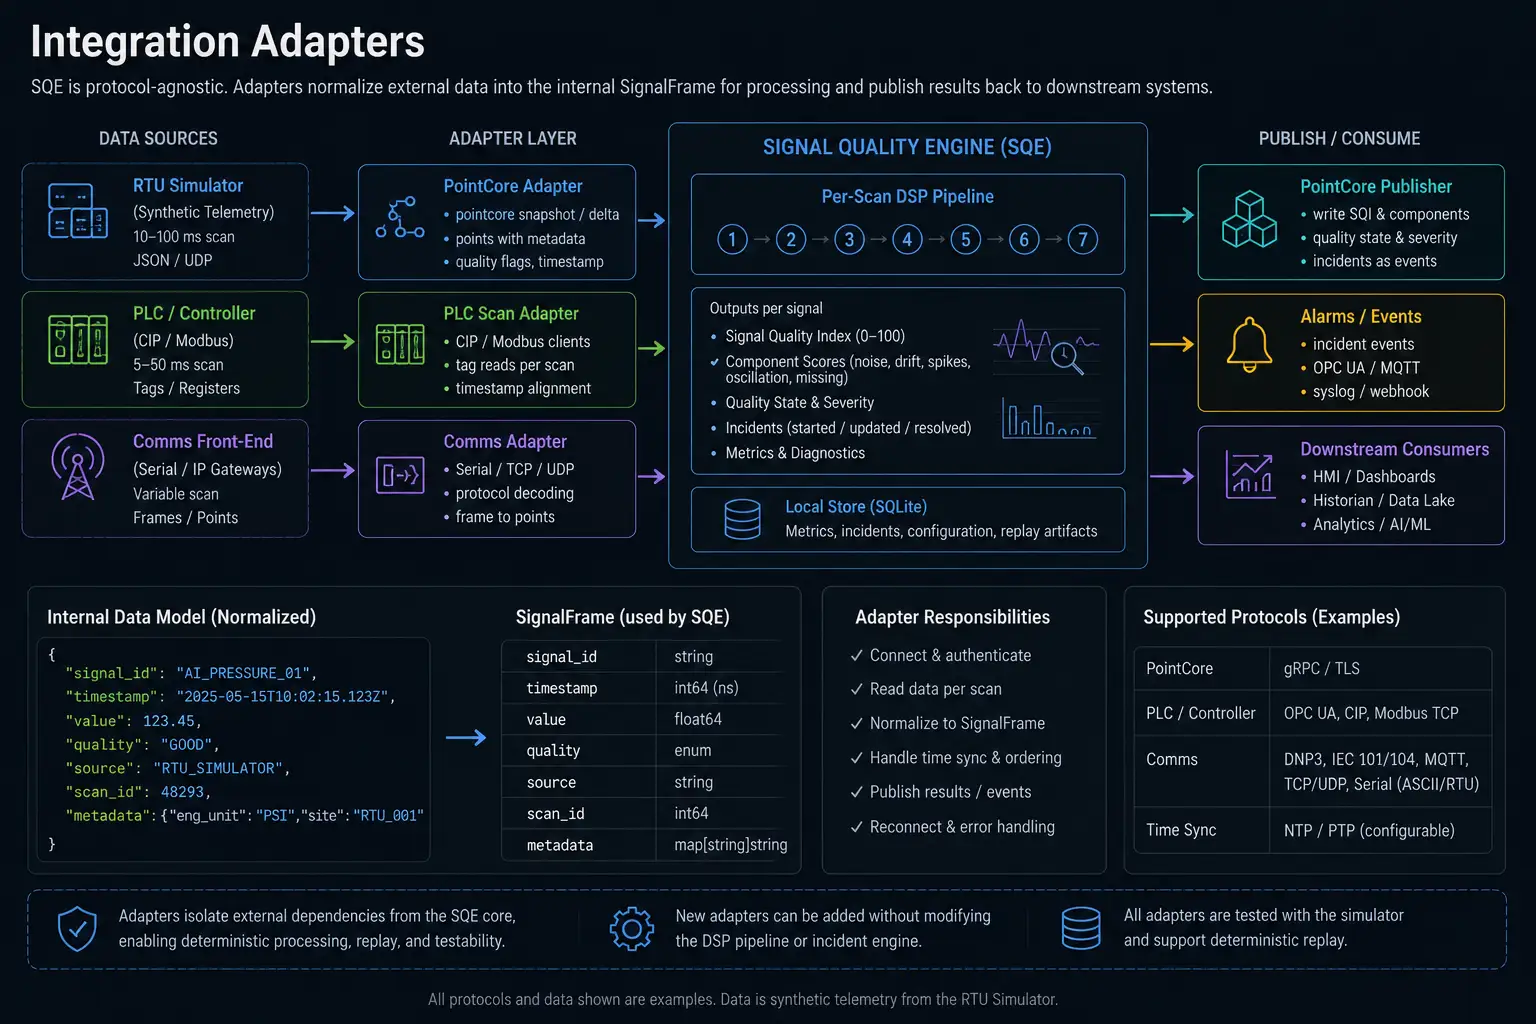
- ~0.1-0.2ms per signal per scan on consumer hardware
- Fixed memory allocation - ~15-20 KB per signal, no dynamic growth
- Typical scan utilization: 10-20% within a 100ms PLC window
- 146+ unit and integration tests, deterministic across runs
All visuals use synthetic telemetry and simulator-style point names. No production utility data, real station names, real HMI screens, or operational network details are represented.
Next steps
Trace the signal through the stack.
These adjacent projects and notes show where SQE sits between upstream telemetry sources and downstream control logic.
SCADA HMI Pipeline
The full telemetry chain - SQE feeds quality-scored signals into operator dashboards, historian-style logs, and alarm evaluation paths.
Related noteTurning Noisy Telemetry Into Stable Incidents
A deeper pass on the incident lifecycle that runs downstream of the quality engine and its SQI scores.